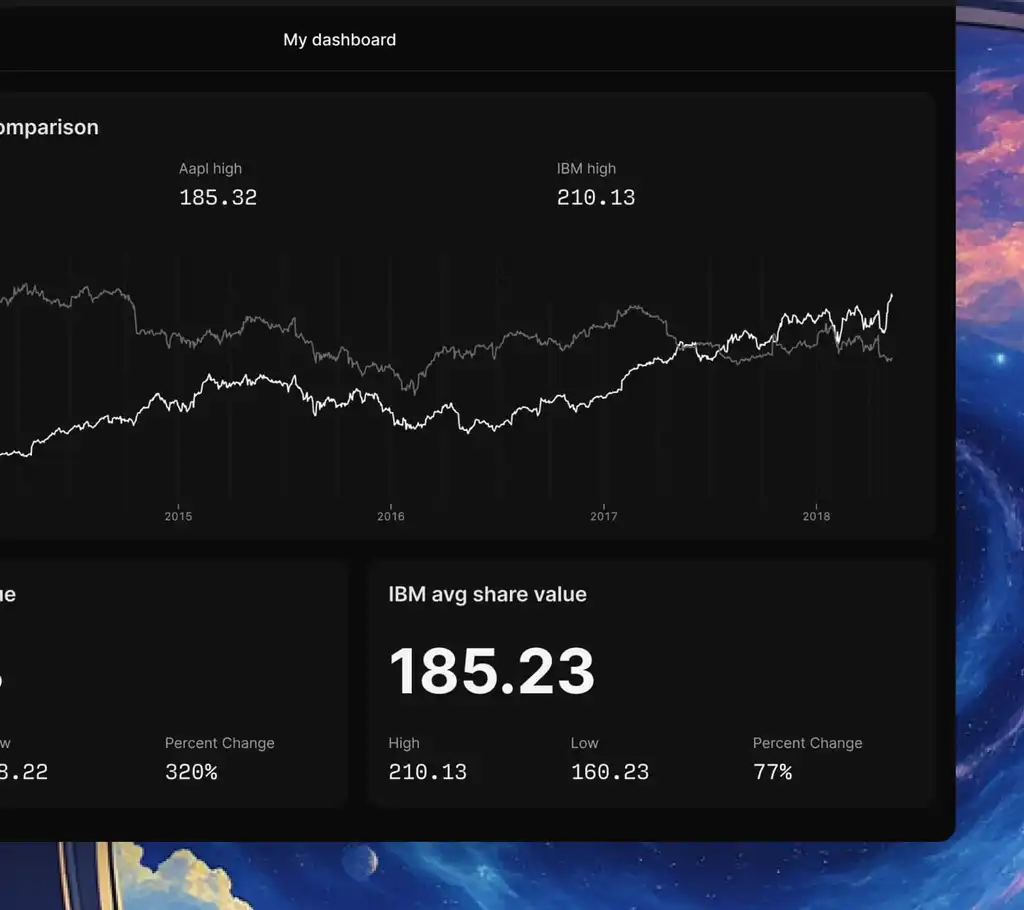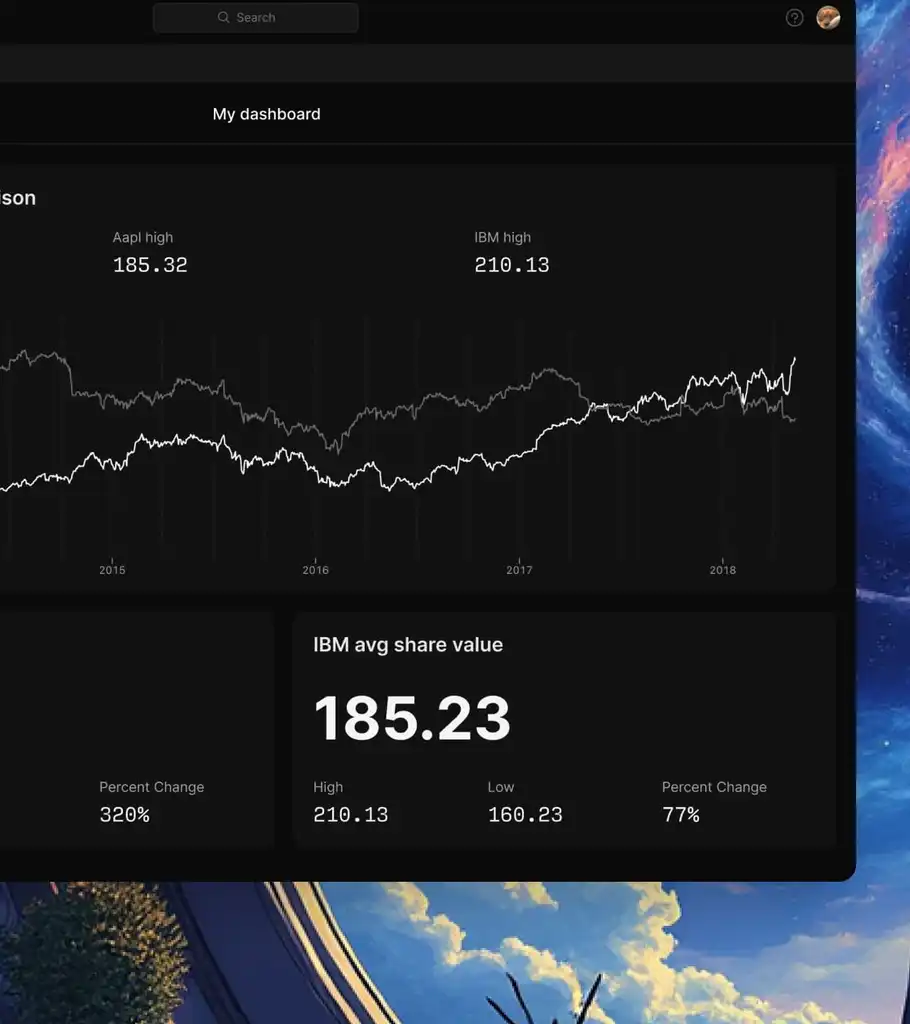

Visualize your data
Turn data into charts in seconds using your queries or simply ask AI to get thoughtful insights on what matters most.
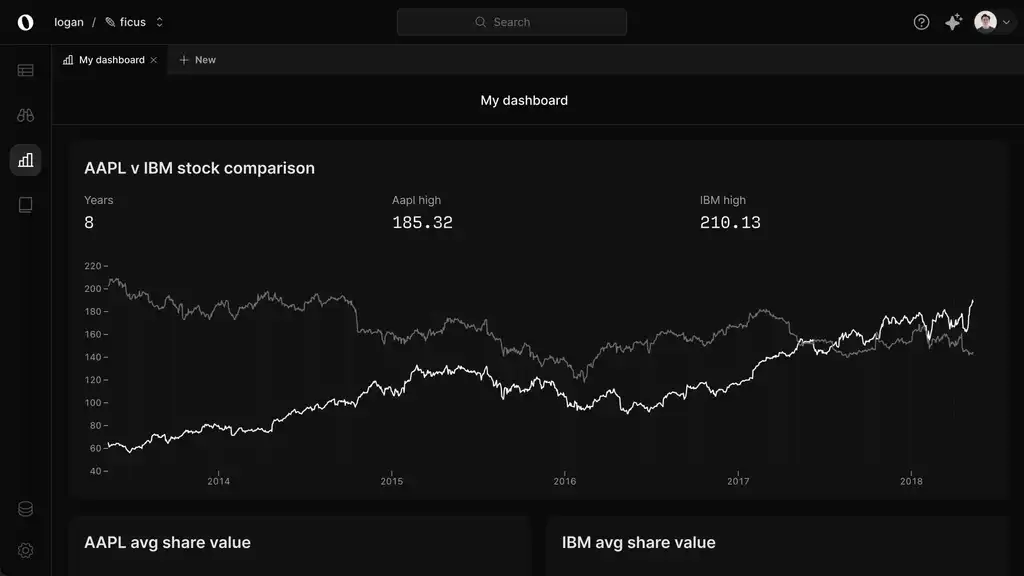
Self-serve analytics
Create dashboards from scratch or let AI build them for you, powered by both SQL and NoSQL queries.
Ask about data visualization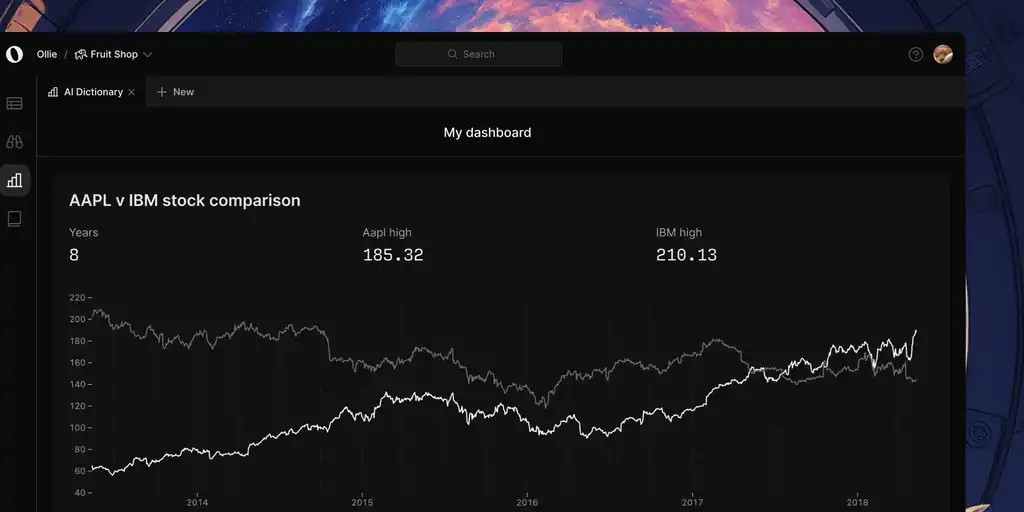
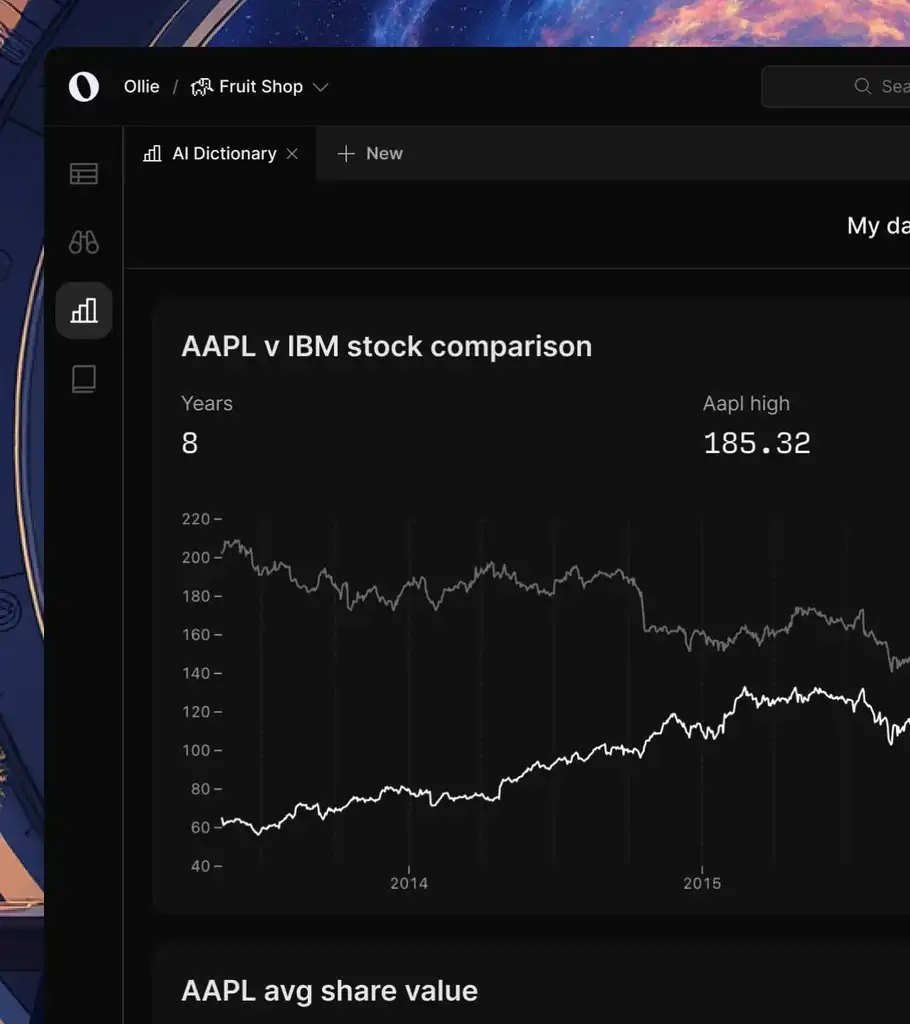
Build better dashboards
Setup
Select your chart type: bar, area, line, table, scatterplot, and more.
Customize
Update colors, legends, axis, labels to fit your brand's needs.
Highlight
Add data callouts to charts to easily track the important metrics.
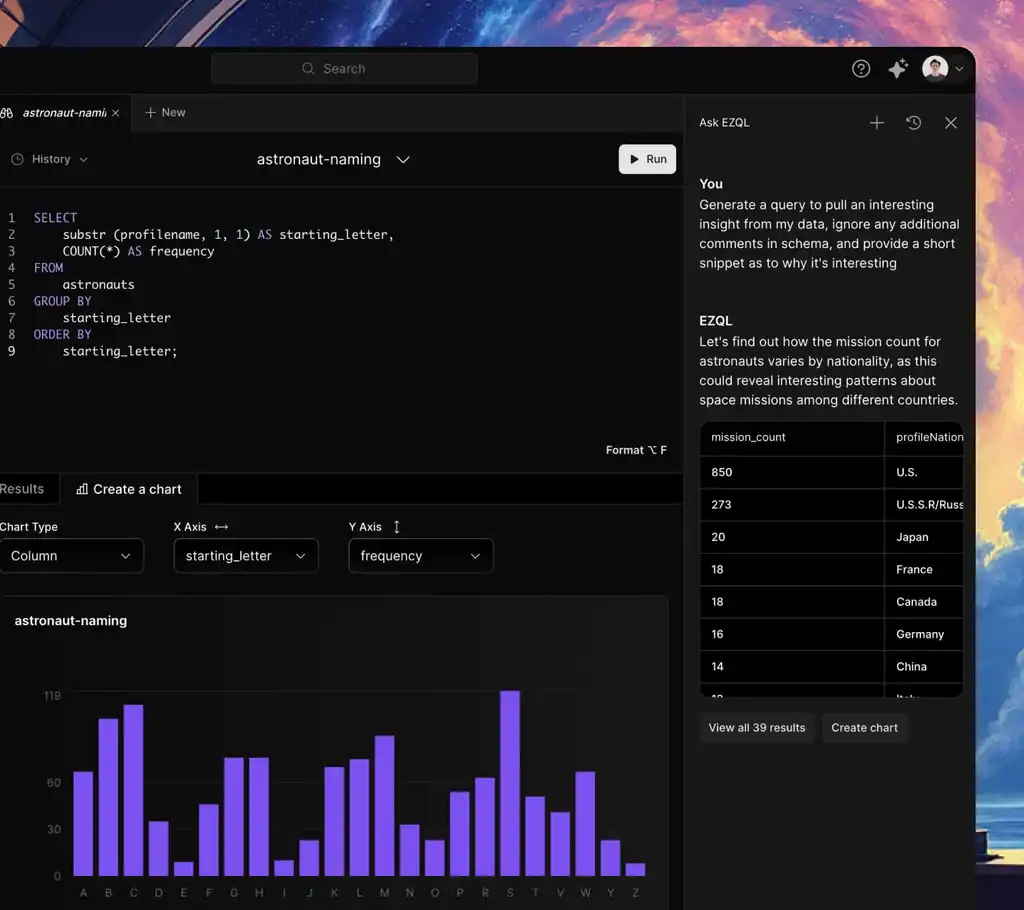
Generative AI-powered insights
Create charts instantly from your conversations with our AI, EZQL™, refine them, and build complete dashboards from your data.
Learn more about Chargezen AI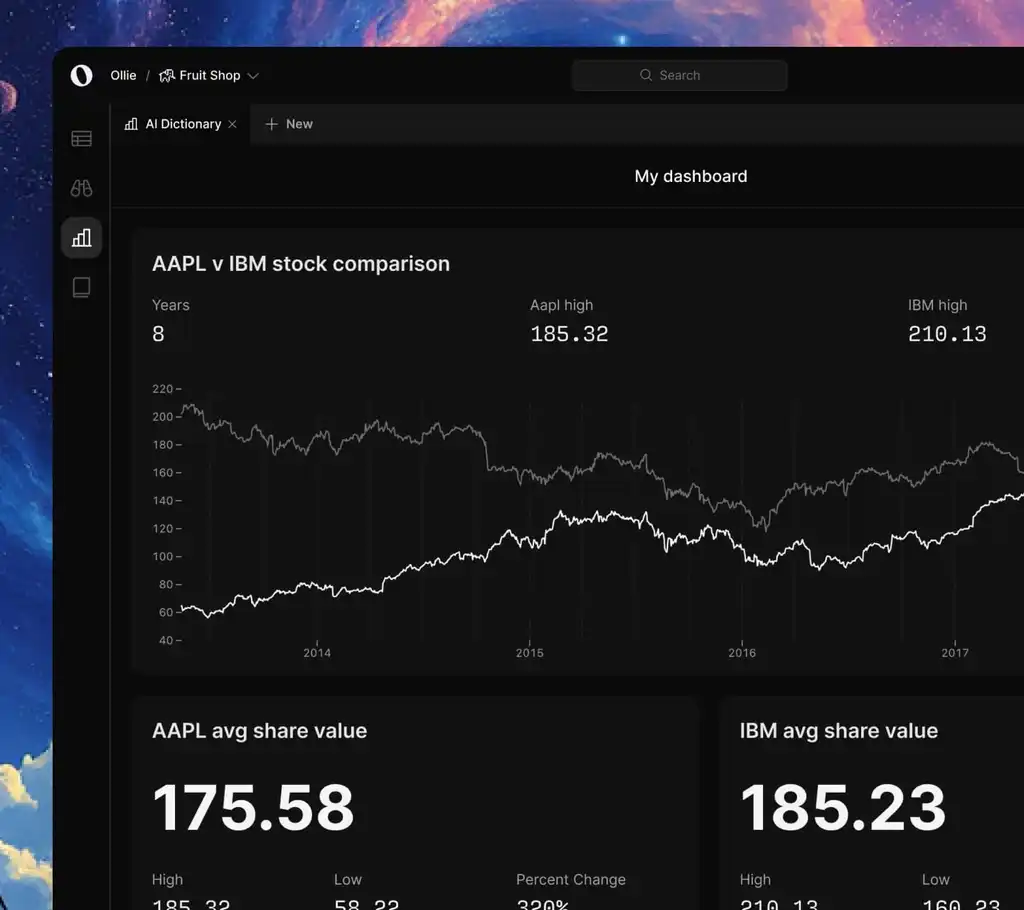
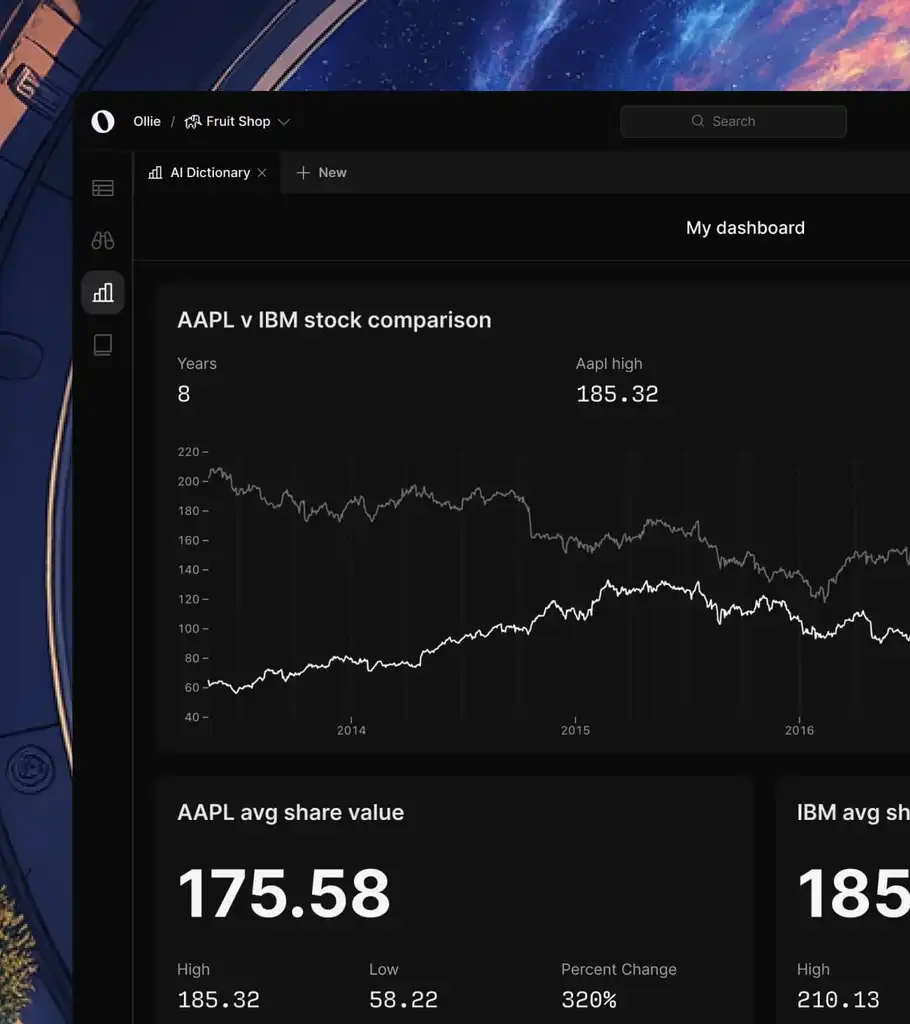
Embed our charts anywhere
Our open-source web components work with any framework or vanilla JavaScript, letting you embed charts wherever you need—without reaching for clunky iframes.
Ask about embedding charts